
PCR Basic Knowledge
“PCR” stands for Polymerase Chain Reaction.
PCR was first developed in 1983 by Kary Mullis, who was awarded the Nobel Prize in 1993 for this extraordinary invention. Indeed, PCR enables the clonal amplification of specific segments of DNA from a single fragment to thousand of millions of copies!
This tool is widely used in molecular biology for a variety of applications- manipulating DNA (cloning, mutagenesis), analyzing genes (though PCR-based sequencing for example), diagnosis or monitoring of pathologies, and also for parental testing or for DNA profiling in forensic studies.
1. What is in a PCR mix?
-
Polymerase
First and foremost, a PCR mix contains a thermostable polymerase, such as the ubiquitous Taq. The Taq polymerase was originally isolated from the thermophilic bacterium Thermus aquaticus in 1971 and is the original enzyme that was used for PCR by Kary Mullis. Since then, many other polymerases have been discovered. They have different properties regarding their tolerance to inhibitors, processivity (length of amplicon generated), speed of synthesis, etc. However, the Taq polymerase, whether in its original configuration or incorporating engineered elements, remains a favorite for PCR-based amplification.
-
dNTPs
The nucleotides are the building blocks of the reaction. They are present in the form of deoxyribonucleotides and are commonly referred to as dNTPs. The “dNTP” denomination means that dCTP (deoxycytidine triphosphate), dATP (deoxyadenosine triphosphate), dTTP (deoxythymidine triphosphate), and dGTP (deoxyguanosine triphosphate) are present in equimolar amounts. Depending on the application, the concentration of individual nucleotides may be further tuned, or some nucleotides may altogether be substituted with analogs, such as 5-fluorouracil or 6-mercaptopurine.
-
Reaction Buffer
Although the polymerase may be active over several pH points, the pH of most PCR commercial mixes is usually around 8 – 8.4 for optimal amplification. The pH of the reaction buffer is controlled by the use of a buffering agent, most commonly Tris-HCl. The reaction also comprises monovalent cations such as K+ and NH4+, divalent cations such as Mg2+, and less commonly Mn2+. The K+ salts neutralize the negative charge on the backbone of DNA and thus stabilize primer-template binding. Mg2+ is an essential co-factor of the polymerase. Its concentration in the reaction affects the specificity and efficiency of the reaction.
Other chemical species can be found in PCR mixes, such as detergents, additional salts, DMSO, or proteins such as bovine serum albumin. These compounds can be included to help with denaturation of the DNA strands, especially in sequences with high GC content, to improve polymerase activity, or to counter the inhibitory effects of substances present in the samples.
-
Primers
In order to amplify a DNA fragment by PCR, two DNA primers (single-stranded oligonucleotides) that are complementary to the 3’ ends of the sense and anti-sense strands of the DNA target are needed (Figure A). To know more about primers, refer to the “Designing Primers and Probes” item!
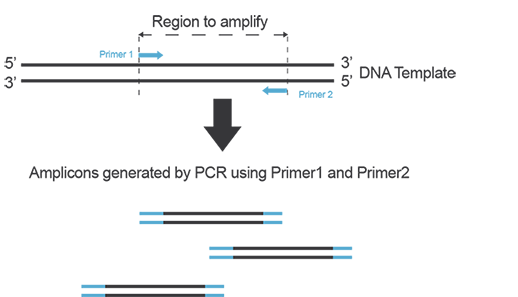
Figure A. Primers anneal to their target on each strand of DNA during PCR and yield amplicons defined by the hybridization location of each primer on the template.
-
Template DNA
Template DNA can be any DNA to be amplified, whether extracted from animal or plant cells, fungi, bacteria, or present in free form- for example circulating DNA in blood or urine. For optimal results, it is recommended to use long-enough purified DNA fragments for amplification to take place. Additionally, caution needs to be exercised to avoid chemical and/or UV-induced damage to the DNA template as it may affect your PCR results.
2. Thermal Cycling in PCR
PCR is based on thermal cycling: the reaction mix is subjected to sequential cycles of heating and cooling, which allow specific temperature-dependent reactions to occur.
-
Denaturation
First, DNA is denatured or melted at a high temperature, typically 94-96°C. During this step, the hydrogen bonds between complementary bases of the double-stranded DNA are broken, yielding two single-stranded molecules. Depending on the type of DNA, the reagents, and equipment used this step usually lasts ranging from 15 seconds to 1 minute and marks the start of each cycle of PCR.
-
Annealing
After denaturation of the template DNA strands, primers anneal to their target on the DNA template. The temperature of this step is critical to ensure specific hybridization of the primers to the target. In practice, this temperature is usually determined empirically- it needs to be low enough to allow primer binding but high enough for the binding to be specific to the intended target. Usually, annealing temperatures are between 3-5°C below the calculated Tm of primers, which translates to annealing temperatures for PCR between 50-65°C. Once the primer has annealed to the DNA, the polymerase binds to the primer-template hybrid and elongation can start.
-
Elongation
During elongation, the polymerase synthesizes new DNA strands by adding free nucleotides (dNTPs) present in the PCR reaction one-by-one, and the polymerization of the new strand complementary to the template takes place in the 5’ to 3’ direction
The temperature for elongation depends on the polymerase used, with 68-72°C being most commonly used. The length of the amplicon is taken into account when determining the time needed for the elongation step with a general rule of thumb of 1 minute per kb to be synthesized. The synthesis rate of the polymerase present in your PCR mix can be found in the manufacturer’s recommendation.
-
Additional steps
Initial denaturation
Before cycling starts, a longer initial denaturation step is often included (90-95°C for 1-10 minutes). Why? Because hot-start polymerases must be activated as these enzymes have been developed to reduce non-specific amplification early in the PCR reaction. Thus, they are locked in an inactive state by binding to an antibody or a chemical inhibitor. At elevated temperatures, a non-reversible dissociation occurs and this unlocks the enzyme.
Final Elongation
A final extension step (68-72°C for 5-10 minutes) can also be included to ensure all amplicons are fully elongated.
3. What happens during PCR?
-
Number of copies of target DNA fragment generated during PCR
If the reaction efficiency is 100%, the number of amplicons doubles after each cycle. This means that each copy of the DNA target initially present will be amplified 2n, where n is the number of cycles of PCR. Thus, when amplifying a single copy of your target region for 40 cycles, you could finally get 240 = 1.1 x 10¹² amplicons!
-
Stages of PCR
Given that the number of amplicons doubles at each cycle when PCR efficiency is 100%, PCR amplification is referred to as exponential.
However, since this is an enzymatic reaction one or more factors will become limiting as the reaction progresses. Moreover, the polymerase may also start to lose activity. This will mean that at some point the amplification will start to level off, before reaching a plateau where no more products are generated.
4. How are the PCR results visualized?
-
Electrophoresis
Traditionally, the products of PCR are run on an agarose gel to visualize the amplicons. The agarose gel is stained with an agent that will bind to DNA (ethidium bromide or GelRed® for example) and illuminated with UV light in order to reveal the various DNA fragments present. Typically, a DNA ladder is run alongside the PCR products to estimate the size of the products, as well as the amount of DNA generated (Figure B).
Other electrophoresis techniques may use capillary gels and fluorescently labeled primers for fine discrimination of amplicon size.
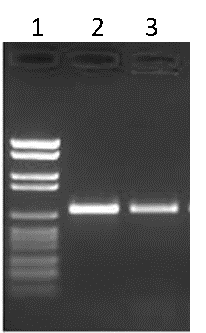
Figure B. Agarose gel electrophoresis. Lane 1: DNA ladder, Lane 2: PCR product 1, Lane 3: PCR product 2
-
Fluorescence
Different chemistries allow the fluorescence detection of DNA molecules. Amongst these chemistries, Hydrolysis probes, SYBR® Green I, and EvagGeen® are the most commonly used.
Hydrolysis probes (TaqMan® probes)
A probe, like primers, corresponds to a short oligonucleotide sequence (different from primer sequences) complementary to the target DNA sequence. Located between the sense and anti-sense primers, the hydrolysis probe consists of a fluorescent dye and a quencher. During amplification, the hydrolysis probe will be cleaved by the 3’->5’ exonuclease activity of the Taq polymerase. This will separate the fluorescent moiety from its quencher (Figure C). These fluorescent molecules will accumulate after each cycle. A fluorescent signal proportional to the number of amplicons bearing the probe hybridization sequence can be recorded. If you want to know more about probes, refer to the “Designing Primers and Probes” item.
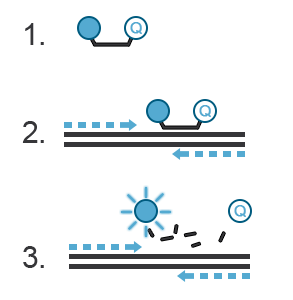
Figure C. Hydrolysis probes. 1. The probe is a single-stranded DNA sequence labeled with a fluorophore at its 5’ end and a quencher at its 3’ end. The fluorescence of the fluorophore is quenched, i.e., absorbed by the quencher- no light is emitted. 2. During PCR, the probe will hybridize with the amplicon generated in a sequence-specific manner. 3. The 3’ to 5’ exonuclease activity of the Taq polymerase destroys the hybridized DNA probe, thus freeing the fluorophore from the quencher. This fluorophore is now free to emit a fluorescent signal.
DNA-binding dye: EvaGreen®
EvaGreen® is a DNA binding dye that can be used to track PCR amplification in most digital PCR systems. It is a green fluorescent dye which becomes highly fluorescent when it is bound to double-stranded DNA. EvaGreen® is a thermoresistant molecule with excitation and emission spectra close to that of SYBR® Green I or 6-FAM dyes. Please note that the advantage of EvaGreen® over SYBR® Green I is its compatibility with droplet-based digital PCR systems. Thus, SYBR® Green I is mostly used in real-time PCR.
When using EvaGreen, the intensity of the fluorescent signal will correlate with the length of the amplicon generated. The longer the amplicon, the more bases available for EvaGreen binding, thus the stronger the fluorescence signal (Figure E).
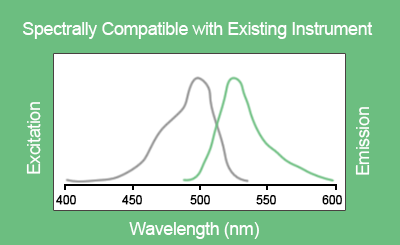
Figure D. Excitation and emission spectra of EvaGreen® in the presence of double-strand DNA in PBS buffer
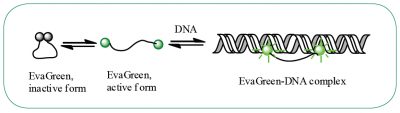
Figure E. EvaGreen® dye binds to double-strand DNA via a “release-on-demand” mechanism.
[https://biotium.com/technology/pcr-dna-amplification/evagreen-dye-for-qpcr/]
Fluorescence detection is the detection system used both in digital and real-time PCR.
Further information about EvaGreen® can be found on the manufacturer’s website
Digital PCR
Most digital PCR platforms use end-point PCR for quantification. End-point PCR means that the results of PCR are assessed when the plateau is reached. It occurs when the amplification has stopped due to loss of polymerase activity or an essential reagent (primers for example) present in the reaction.
In these reactions, fluorescent reporters are used. It can be DNA-binding dyes such as EvaGreen or fluorescently-labeled hydrolysis probes.
For further information on digital PCR refer to the “Principle of Digital PCR” item.
Real-time PCR
The intensity of the fluorescent signal is recorded at each cycle of PCR. The results are visualized on a graph where the intensity of fluorescence is plotted against the number of cycles. During the first few cycles, the fluorescent signal generated by the fluorescent reporter is indistinguishable from the background. As amplification takes place during cycles, the fluorescence eventually increases above noise level before tailing off and reaching a plateau.
Due to the accumulation of amplicons, the exponential increase of fluorescence can be visualized on the graph. A threshold for fluorescence intensity is placed at the beginning of this exponential phase. The cycle number at which the amplification curve intersects the threshold is called Cq (Cycle quantification). The quantification of an unknown sample assumes the use of a standard curve. By comparing the Cq obtained for DNA samples of known concentration with the Cq obtained for the unknown sample, DNA concentration in the unknown sample is then determined (Figure F)
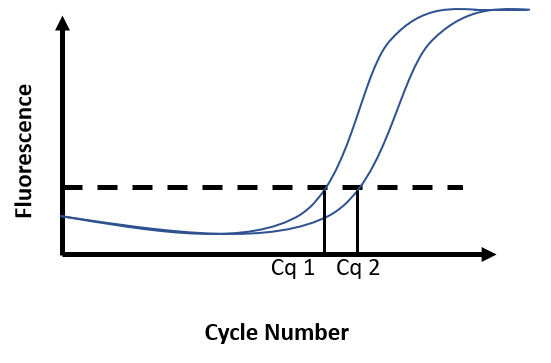
Figure F. Real-time PCR results. Fluorescence intensity is recorded at every cycle and plotted against the cycle number. Reaction 1 has a known DNA concentration (Cq1). At 100% efficiency, the DNA content in the reaction doubles at each cycle. Broadly, if Cq2 is distant from Cq1 from 1 cycle, this means there was half as much DNA in reaction 2 as there was in reaction 1 at the start of the PCR.