
First of all, let’s assume that a target gene concentration has been estimated together with its relative uncertainty, by applying the Poisson law as explained in the item [Poisson Law application].
Depending on the target concentration value in the well, the Relative Uncertainty forms a U-Curve which is made of 2 asymptotic curves:
-
The sampling error curve, occurring at low target concentrations (on the left side in the [Figure A] below);
-
The quantification error curve, occurring at high target concentrations (on the right side in the [Figure A] below).
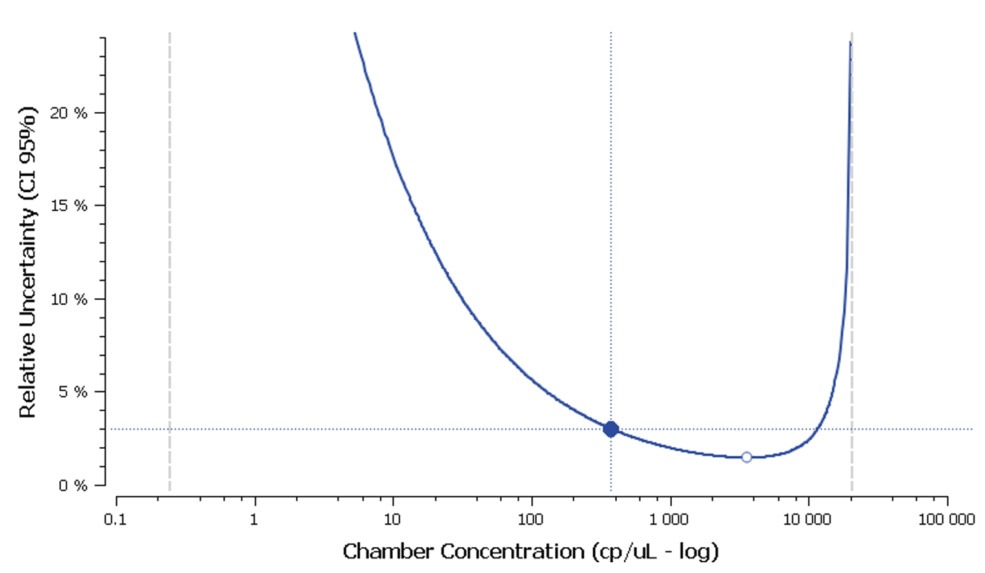
Figure A. Relative uncertainty curve (U-Curve) as a function of the target concentration
in a well that includes 28 000 partitions (in logarithmic view).
-
The sampling error can be approximated as follows:
\( CU_{sampling} \sim \dfrac{z_c}{\sqrt{C_{0} \ V} } \)
where \(V\) is the total partition volume, \(C_{0}\) is the well concentration, and \(z_c = 1.96\) for a confidence level of 95%.
-
Note that, whatever the total number of partitions \(N\) and the confidence level \(z_c\) the relative uncertainty is always minimized at \(\dfrac{p}{N} \sim 79.7 \), which corresponds to the white point lying on the U-Curve in the[Figure 1] above.
The Minimal & Maximal Limits of Detection are represented by 2 vertical lines framing the U-Curve:
-
-
The Minimal Limit of Detection \(LOD_{min}\) at 95% (left vertical dotted line in the [Figure 1] above) is the smallest target concentration in the well for which probability of having at least 1 positive partition is more than 95%. If the Limit of Blank is zero, we have:
-
\(LOD_{min} = \dfrac{3}{V}\)
-
-
The Maximal Limit of Detection \(LOD_{max}\) at 95% (right vertical dotted line in the [Figure A] above) is the highest target concentration in the well for which probability of having at least 1 negative partition is more than 95%) for \(N\) ranging from 10 000 to 1 000 000:
-
\(LOD_{max} \sim 10 \ \dfrac{N}{V} \)
-
-
The Dynamic range of Detection \(DrD\) at 95% is the number of decades from \(LOD_{min}\) to \(LOD_{max}\) at 95%. If the Limit of Blank is zero, we have:
-
\(DrD \sim log_{10}(N) + 0.5 \)
- The Minimal & Maximal Limits of Quantification are defined with respect to a maximal relative uncertainty \(U_{max}\) which is considered as acceptable for the current digital PCR experiment:
-
-
The Minimal Limit of Quantification \(LOQ_{min}\) at 95% is the smallest target concentration in the well for which the relative uncertainty at 95% is smaller than \(U_{max}\) .Its value is given by the first intersection point of the 95% U-Curve and the horizontal line \(y = U_{max}\) (which corresponds to the blue point lying on the U-Curve in the [Figure 1] above).
- The Maximal Limit of Quantification \(LOQ_{max}\) at 95% is the highest target concentration in the well for which the relative uncertainty at 95% is larger than \(U_{max}\)Its value is given by the second intersection point of the 95% U-Curve and the horizontal line \(y = U_{max}\) (see the [Figure 1] above).
-
- Finally, the Dynamic range of Quantification \(DrQ\) associated with an acceptable uncertainty value \(U_{max}\) is given by this formula:
\(DrQ (U_{max} )= LOQ_{max} (U_{max} )- LOQ_{min} (U_{max} )\)
Curve, Dynamic, Error, LOD, LOQ, Quantification, Range, Sampling, U-curve, Uncertainty