
Advanced Threshold Setting
When the different populations are not well separated, automatic thresholding fails and must be manually adjusted. The threshold is usually set using horizontal or vertical bars.
- When a single fluorophore assay is used, the 1D dot-plot enables manual threshold setting:
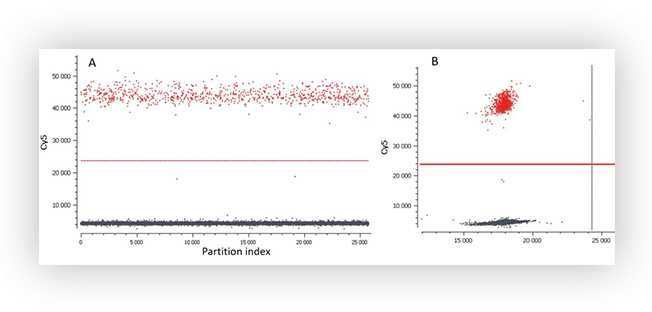
Figure A. 1D plot (A) and 2D plot (B) of a digital PCR experiment with a simplex assay. The positive and negative populations are well separated and the software has successfully calculated a threshold.
- When two or more fluorescent assays are used, it is advised to visualize the 2D dot-plot of the results to verify if both thresholds are correctly set. Furthermore, the visualization using 2D dot-plot can be useful to understand how populations are distributed.
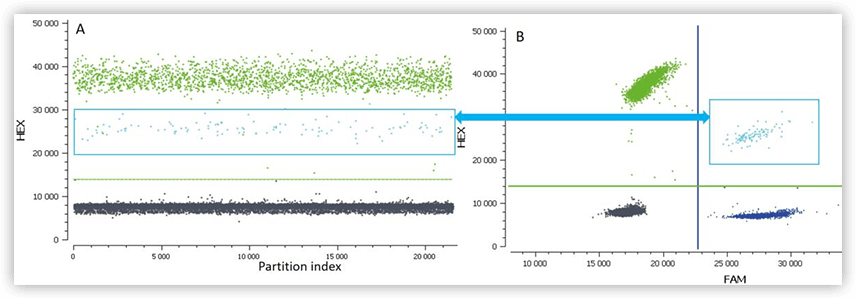
Figure B. 1D plot (A) and 2D plot (B) of a digital PCR experiment with a duplex assay (FAM and HEX). The light blue population corresponds to partitions containing one or more targets detected both by the HEX and the FAM assays (double-positive partitions). Due to competition for the PCR reagents in these partitions, the intensity for HEX fluorescence is decreased for the double-positive population. The threshold on the 2D dot-plot must be set to accommodate this intermediate population in the HEX channel.
- Finally, if you need to manually adjust the threshold, do not forget to have a look at the wells containing your positive and negative controls included in each experiment. They provide information that can be useful for threshold setting.
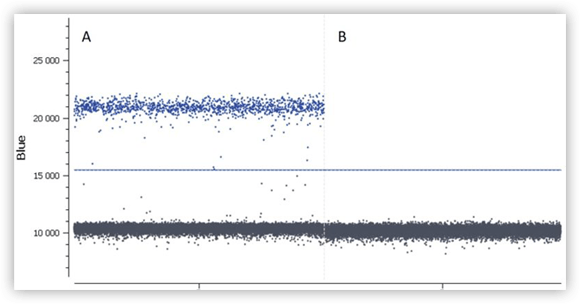
Figure C. Results obtained for positive (A) and a negative (B) controls.